11. January 2016 / c5e3
After I managed to combine 2 dongles for an FFT in gnuradio, I wanted to pipe the output to gqrx and add 2 more dongles to the flowgraph. Due to the cut-off at the edges of each dongle, we get 8.4 MHz bandwidth, but since the rational resampler only supports integer values, our sample rate is 4*2.4e6 = 9.6. Use interpolation=35 and decimation=10 for the true sample rate of 8.4 MHz. I updated the 8.4 MHz flowgraph at the bottom of the page.
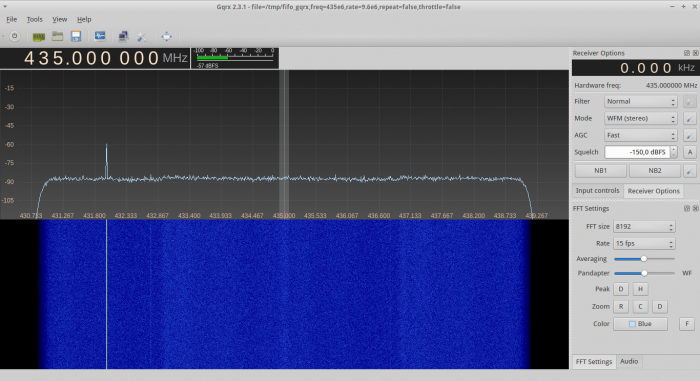
You can even listen to analog signals, that are at the overlapping areas!
8.4 MHz sample rate:
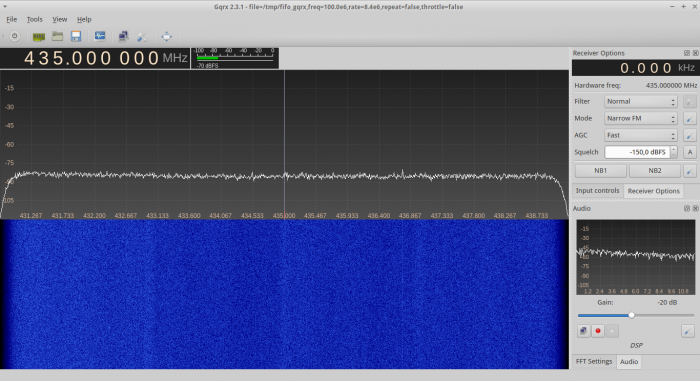
9.6 MHz sample rate (8.4 MHz bandwidth) with old flowgraph:
At first you need to create a fifo file with this command: mkfifo /tmp/fifo_gqrx
Use this settings in gqrx (change ‘freq’ to the value of center_freq in grc): file=/tmp/fifo_gqrx,freq=100e6,rate=9.6e6,repeat=false,throttle=false
Also make sure, that you set the center frequency in gqrx.
You might have to open gqrx some times if it crashes on startup, but it will work!
Here are the grc-files (right click, save file as):
4.4 MHz (4.8 MHz sample rate)
8.4 MHz (8.4 MHz sample rate)
7. January 2016 / c5e3
A while ago, I had the plan of taking 2++ RTL2832U SDR dongles to get a wider spectrum in a FFT-plot. Since I had no idea of gnuradio-companion then, I didn’t know how to do this. But thanks to my purchase of a HackRF One, I was forced to use GRC and found some very useful tutorials about SDR in general, with special attention to the HackRF One. You can find the lessons by Michael Ossmann here: http://greatscottgadgets.com/sdr/
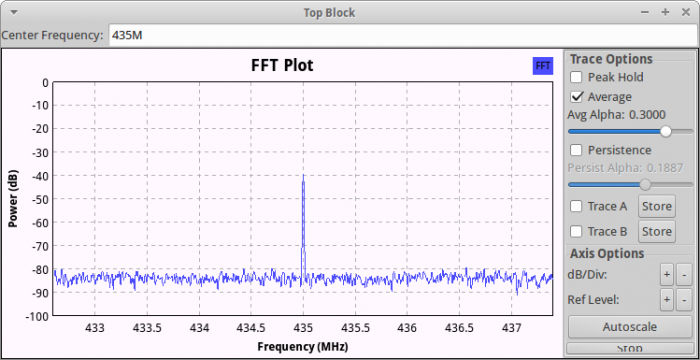
So, now that I knew a thing or two about gnuradio, I opened an empty flowgraph and this is the final outcome with 4.4 MHz of bandwidth:

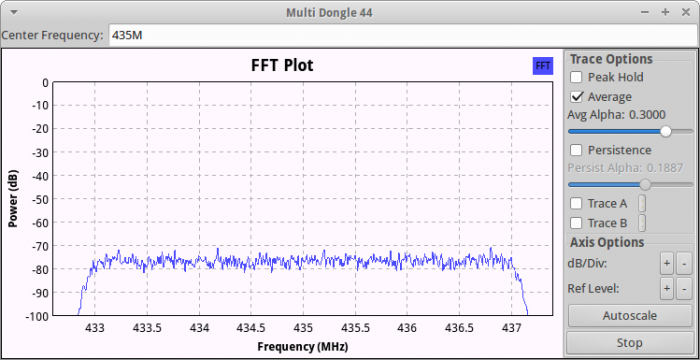
I simply took two RTL-SDR dongles at their max. bandwidth of 2.4 MHz, resampled the signals to 4.8 MHz, then shifted the first signal down by 1MHz, the other one 1 MHz up, added them together, divided the combined signal by 2 to lower the noise floor again and finally feed it into a FFT plot.
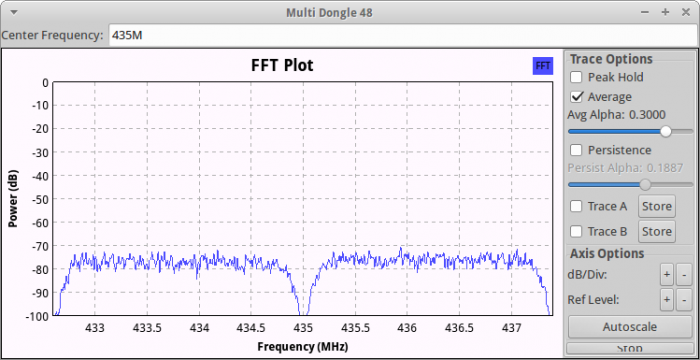
At first, I tried shifting the signals by 1.2 MHz to get full 4.8 MHz , but I realized, that I had a notch in the center, so I reduced the frequency shift until I had no notch anymore.
Compared to the HackRF One at 4.8 MHz sampling rate:
Notice, that this isn’t any useful to decode or demodulate any signals, because of phase and clock misalignment, but it can be very handy, if you want to view a larger spectrum than 2.4 MHz and don’t want to spend money in a more expensive SDR, that can be used at higher sampling rates.
If you want to check out the flowgraph or edit it for even more RTL-SDRs, feel free to download it here:
4.4 MHz GRC flowgraph
4.8 MHz GRC flowgraph (with notch at center frequency)